Numerical simulation center of LY Power, established in 2018, applies the numerical simulation and simulation calculation technology to products development. The center has 21 professionals (3 with doctor degrees and 18 with master degrees), and 16 high performance computers.
Based on the platform of ANSYS-CFD, through practical problem analyzing, geometric modeling, physics-math modeling, simulation calculation, performance analyzing, etc, combined with secondary development of software to build and modify the mathematical model, the actual application effect can be predicted accurately.
Numerical simulation technology used on
| 1.Velocity field prediction of flue gas | |
 |
 |
 |
 |
| 2.Wall temperature distribution at heating surface | |
|
|
 |
| 3.Slagging prediction on heating surface |
|
|
|
|
 |
| 4.Velocity field prediction |
 |
| From the above velocity field, it can be seen that the different flow patterns of primary air in the burner (inward or outward) lead to significant differences in the flow field of furnace, and the penetrability of primary air under working condition of left side is significantly higher than that of right side. |
 |
| Different flow patterns of burners lead to significant differences in flow field of furnace |
| 6.O2 concentration field prediction |
|
|
| The distribution of pulverized coal in working conditions 1 and 2 and the difference of pulverized coal burning area in furnace lead to different oxygen concentration distribution characteristics. The oxygen-poor region (dark blue) in the figure corresponds to the main region where pulverized coal combustion occurs. |
| 7.Pulverized coal distribution prediction |
 |
| Different flow patterns of burners lead to a significantly different distribution of pulverized coal concentration in furnace. The penetrability of pulverized coal in working condition 1 is significantly higher than that in working condition 2 so that a large number of pulverized coal is concentrated in the center of furnace, while in working condition 2, pulverized coal is mainly distributed near the burner outlet. |
|
|
| (1) Different flow patterns of burners lead to significant differences in the flow field in the furnace, and the penetrability of the primary wind in working condition 1 is significantly higher than that in working condition 2.(2) In working condition 1, the reflux region is located between the inward primary wind and the outward secondary wind, while in working condition 2, the central reflux region is formed. |
| 8.CO concentration distribution prediction |
|
|
| Due to the strong penetration of pulverized coal in working condition 1, combustion occurs mostly in the center of furnace, resulting in CO producing. In working condition 2, due to the good diffusion characteristics of pulverized coal and the existence of a large central backflow area that is favorable for ignition, pulverized coal combustion and the CO generated are mostly near the burner outlet. |
| 9.Heating transfer of furnace wall |
|
|
| Compared with working condition 2, in working condition 1 has a stronger penetration of pulverized coal, and most of its combustion heat release occurs in the central area of furnace, resulting in a small heat transfer on the front and rear walls. At the same time, due to the poor diffusion of pulverized coal and poor mixing with air, more heat release occurs in the higher area, so that the overall heat transfer of the furnace wall occurs in a higher position. |
| 10.Pulverizing system prediction | |
|
|
|
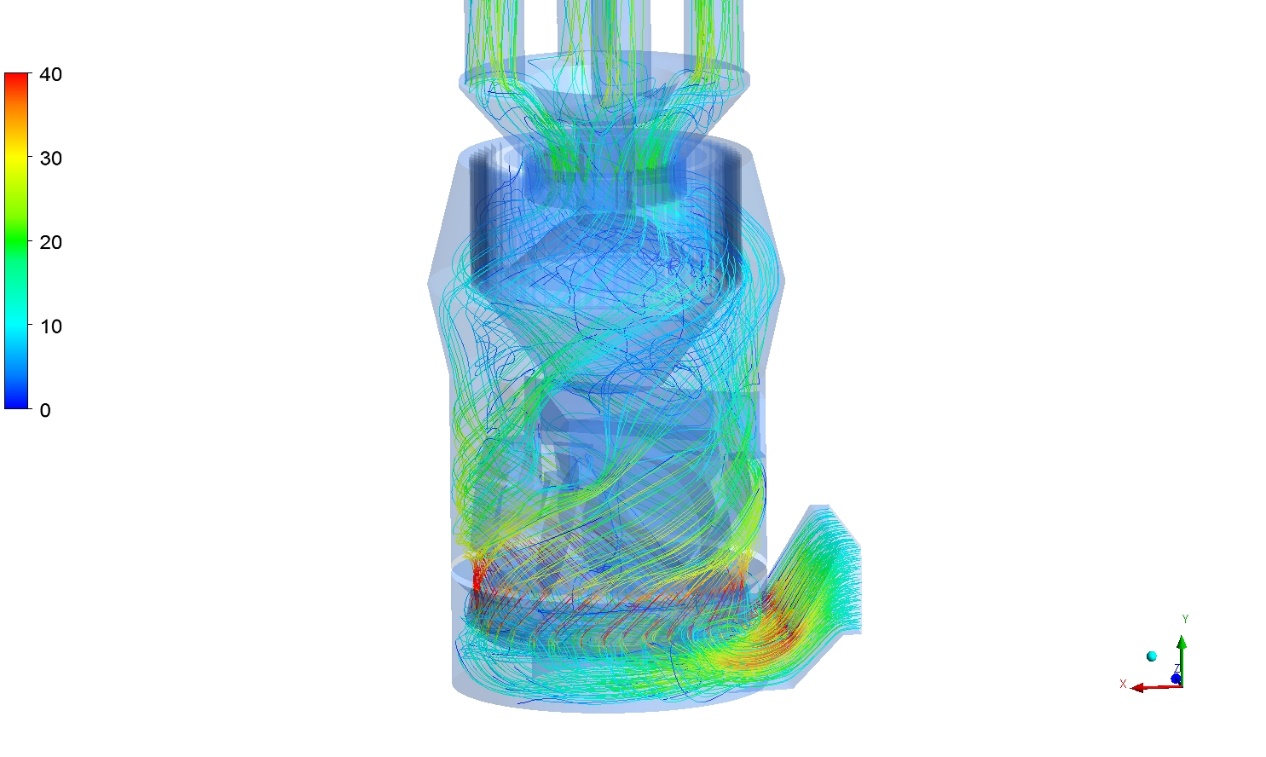
| The use of numerical simulation and simulation technology can predict the separation efficiency of the dynamic/static separator of the coal mill, wall wear, particle concentration distribution, the moisture content of the pulverized coal after drying, and the distribution ratio of the air volume and powder volume of each pulverized coal pipe by the distributor. |
Post time: May-10-2023


